by Adrienne Harris Thomas
The Santayana Edition has introduced a new web resource! Select “Map of Travels” under the “About Santayana” tab, and view and interact with a map tracking Santayana’s travels from his retirement in 1912 until his death in 1952 (see Figure 1).
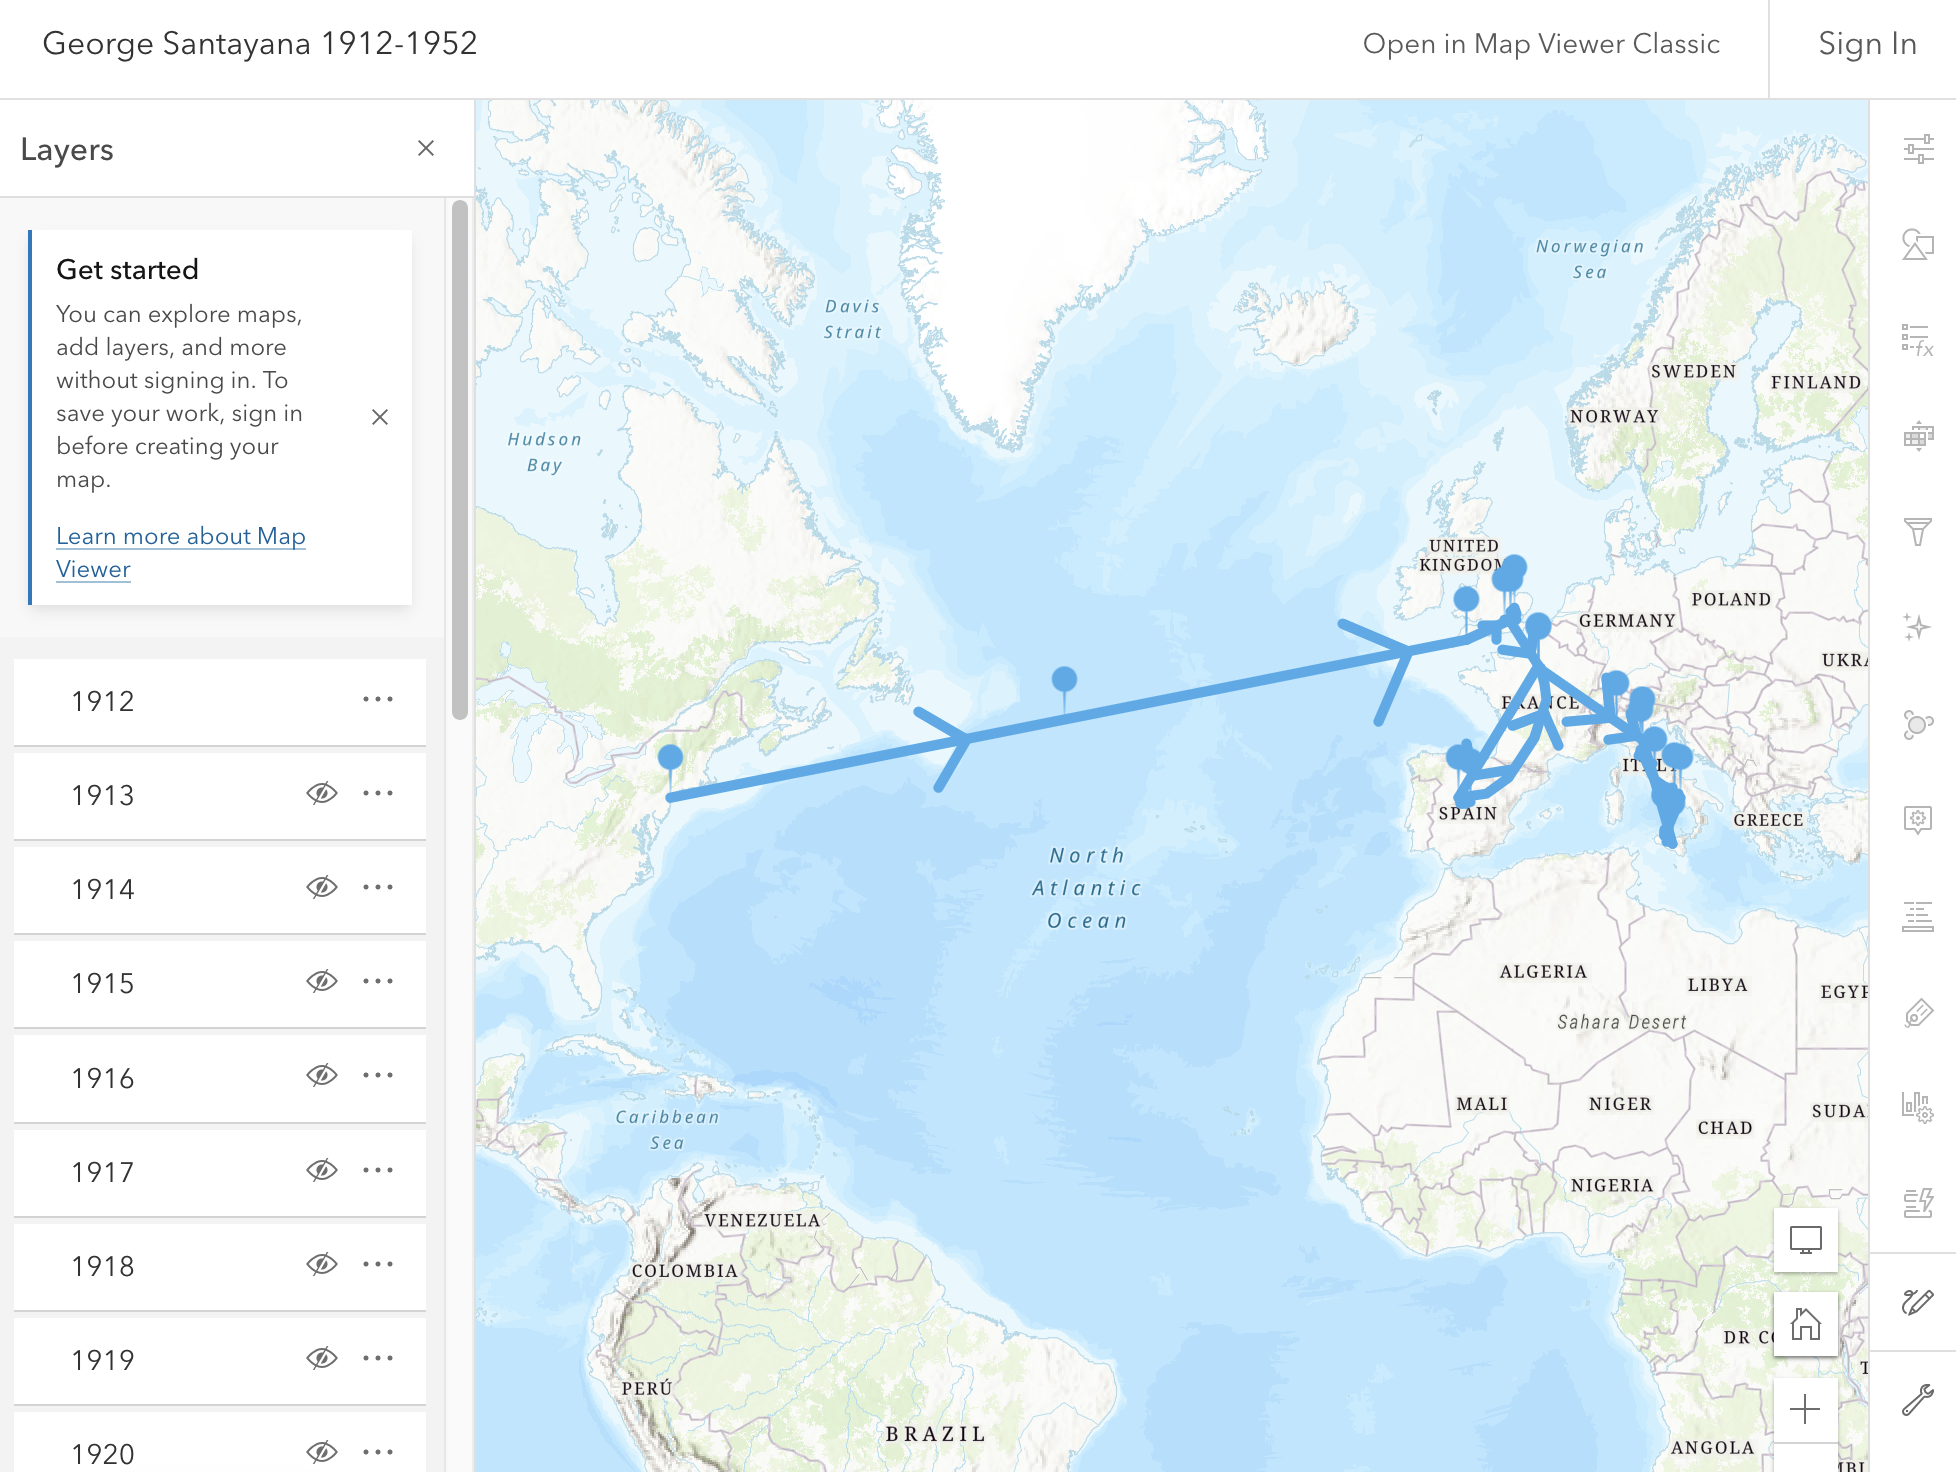
Figure 1: A map of Santayana’s 1912 travels.
The map allows you to toggle between years and select locations marked by a pushpin icon that, when clicked on, opens a pop-up box listing locations (sometimes with specific addresses), the dates Santayana was there, links to the letters Santayana wrote while there, and, occasionally, information on projects he was working on or contemporaneous publications (see Figure 2). To maintain chronological and spatial clarity, arrows depict the progression of his travels (the arrows do not represent the exact route Santayana took to travel between locations; rather they indicate the general spatial order of his travels.)
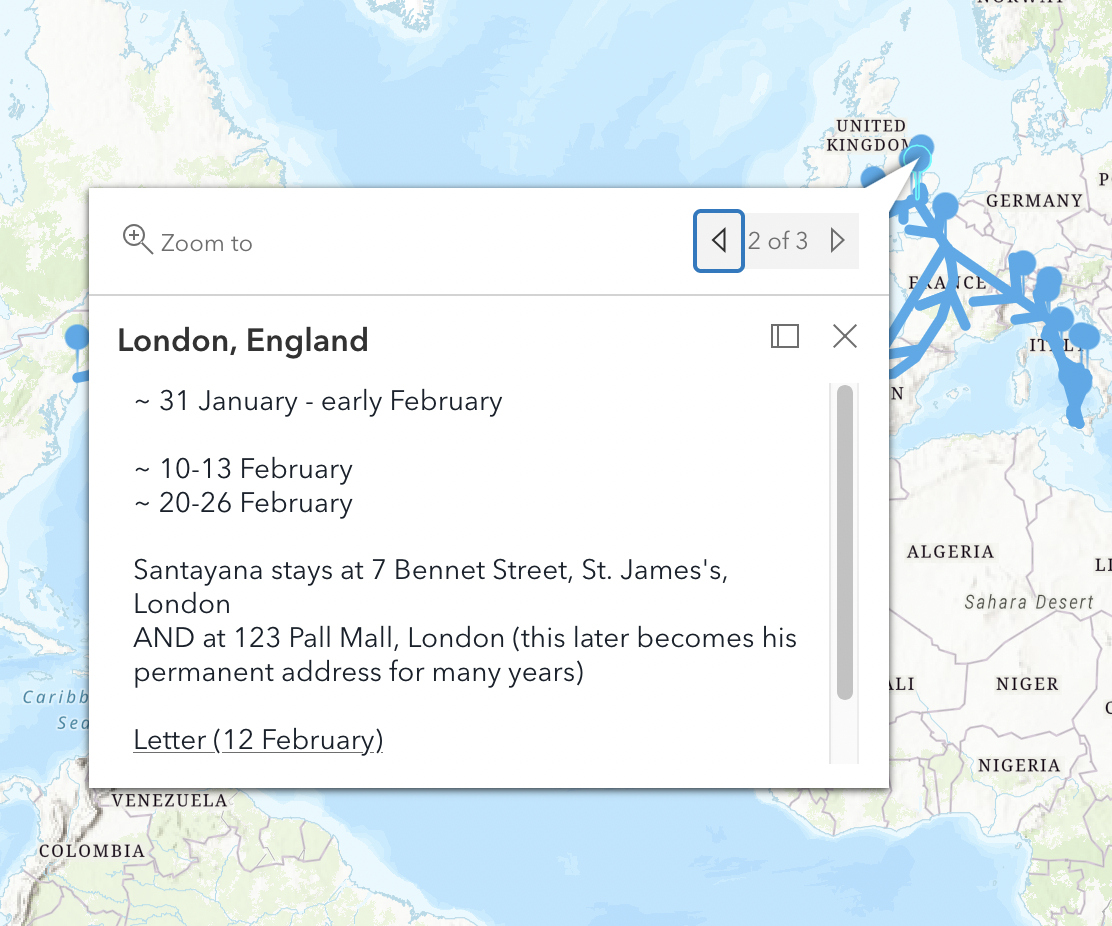
Figure 2: The pop-up box that appears after clicking on a push pin icon marking a particular location.
As the world becomes increasingly digital, academic scholarship can create tools to communicate research results more easily and more widely. This map, created to take advantage of the tools and methods of digital humanities for The Santayana Edition, leads you on a virtual exploration of the life and travels of George Santayana. A chief value of the map lies in providing geographical awareness of Santayana’s life at a time when he wrote some of his best-known works. The map benefits experienced Santayana scholars, interdisciplinary researchers, and students. It can enrich individual research as well as the classroom.
The process of creating the map was fairly simple. After collecting the data (dates, locations, addresses, etc.) from The Letters of George Santayana, I used the Map Viewer program on ArcGIS Online to construct the map. This involved creating layers for each year, plotting points at each location, adding the pertinent information to the pop-up boxes, drawing the arrows to indicate the timeline/progression of travel, and formatting the shape and color of the location points and arrows to visually delineate between years if multiple layers are selected. Multiple variations were created and reviewed by Santayana scholars and a geographer familiar with ArcGIS to determine the most effective and useful version possible with this platform.